© www.weathercharts.org
Web page updated (removed error 404 urls) on 16 April 2023 Disclaimer click here.
Meteorological Charts North Atlantic and Europe
Latest Satellite Image for Europe
MSLP Analysis - Forecast - Europe - North Atlantic
MSLP Analysis with Observation Data - Europe - North Atlantic
MSLP - Forecast - Europe - North Atlantic
Forecast Models - Europe - North Atlantic
Temperature - Cloud - Europe - North Atlantic
Precipitation - Europe
Hydrological data for United Kingdom
Wind - Europe
Radiosonde - Upper Air Charts
Archived Surface Analysis and Historical Charts
British Isles Daily Weather diary / summary years 1999.2000.2001.2002.2003.2004.2005.2006.2007.2008.2009.2010.2011.2012.2013.2014.2015.2016.2017.2018.2019.2020
Meteorological Office UK Monthly Weather Summaries for 2012, 2013, 2014, 2015 - YouTube Video
2012 . . . . . . . . . . . . . . . . . . . . . .. . April.May.June.July.August.September.October.November.December
Climate
North Atlantic Oscillation
Aviation Weather
METAR . . TAF . . SNOWTAM
METAR . . . . . . Decoded into English Text . . EuropeSNOWTAM . Decoder into English text . . JavaScript
METAR .. TAF .. Aerodrome Reports Selected From Map
Snow Cover - Europe
Arctic - Antarctic
Satellite - Arctic - Antarctic
Sea & Ocean - Temperature - Wave - Swell & Wind Conditions
All Ocean & Sea Area Significant Weather. .North Atlantic Wave Height and Direction. .Plotted Marine Observations. .Sea Surface Temperature
Sea & Ocean Temperature - Conditions - Gulf Stream - NW / SW Atlantic - Canadian Arctic Ice
Sea Surface Temperature . . . Gulf Stream North - SouthNorth West AtlanticSouth West AtlanticGulf of Mexico
Tides - High & Low Water - Height - Not for navigation or safety. Please refer to official tide tables for operational use.
Please use any Tide Prediction Software for General Awareness or Interest Only. . . Refer to Official Tide Tables Where Safety and / or Navigation is Required.
SOFTWARE -Jtides (Freeware)
Sferics - Lightning - Europe
World Wide Lightning Location Network WWLLN . . . Wideband VLF Spectrum Charts
Stormvue / Boltek Lightning Detectors - 350 mile radius Europe
Polar Orbit Satellite Imagery
Geostationary Satellite Imagery
North America. . . . .Europe. . . . .Pacific Ocean.
Satellite High Resolution Imagery
Satellite Standard Resolution Imagery
Global Imagery . . . . . . Cloud Tops. . . . . .Tropics
UK Weather RADAR
Mainland Europe Weather RADAR
Satellite High Resolution Imagery
Meteorological Links 1
Meteorological Links 2
Satellite Imagery of Iceland Volcano Ash - Eyjafjallajokull - Eruption Advisory
Radio Facsimile and Volmet Broadcasts
NAVTEX . live messages . Cullercoats . Niton . Ostend . Portpatrick.Please note data maybe unreliable. Use official data source for ALL navigation and safety
Road and Weather Webcams - UK - Europe
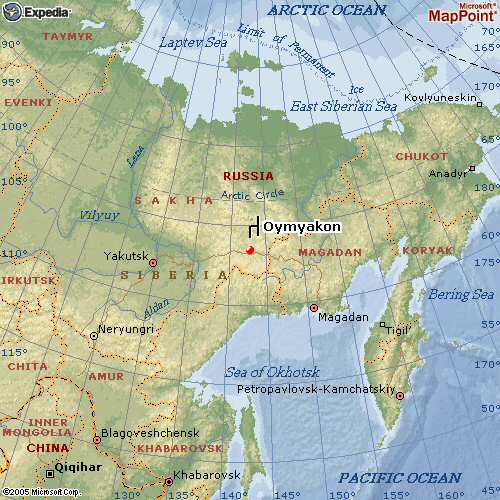
Oymyakon (Oimyakon - Oimekon - Oimjakon) Russia
Oymyakon Geographic Map 1. . . . . . .Oymyakon Geographic Map 2
Siberian Cold Locations
Miscellaneous
UK Metoffice Yourube Videos Monlthly for year 2014 . . .January.February.March.April.May.June.July.August.September
Geological
Site Map - www.weathercharts.org (global) charts - page 2
Alaska
Argentina
Atmospheric Phenomena
Australia
Aviation Weather Global
Canada
China
undefinedEl Ninoundefined
undefinedEurasiaundefined
undefinedEurope and North Atlantic - Forecast Modelsundefined
undefinedEurope and North Atlantic - Forecast - Gale - sigwxundefined
undefinedFranceundefined
undefinedGlobal Medium Range Forecastsundefined
undefinedGlobal Weather and Climateundefined
undefinedGreeceundefined
undefinedGreenlandundefined
undefinedHawaiiundefined
undefinedHong Kong and Surrounding Countriesundefined
undefinedHurricane Katrina and other Past Hurricanesundefined
undefinedHurricanes Typhoons Tropical Stormsundefined
undefinedIceland Greenland - North & South Polar Regionsundefined
undefinedIndiaundefined
undefinedItalyundefined
undefinedJapanundefined
undefinedMalaysia and Sumatra - Borneo - Philippinesundefined
undefinedMauritiusundefined
undefinedMiddle Eastundefined
undefinedMiscellaneous Informationundefined
undefinedNew Zealandundefined
undefinedNorth America - Canada - Alaskaundefined
undefinedPacific Ocean - Indian Ocean - South Atlanticundefined
undefinedPakistanundefined
undefinedRussiaundefined
undefinedSatellite Images Northern Hemisphereundefined
undefinedSferics and RADAR Various World Locationsundefined
undefinedSiberiaundefined
undefinedSouth Africaundefined
undefinedSouth Americaundefined
undefinedSouth Asiaundefined
undefinedUpper Atmosphere North America - Canada - Polarundefined
undefinedWorld Weather Observations and Forecastsundefined
undefinedundefinedweathercharts.org - miscellaneous - page3undefinedundefined
undefinedundefinedArctic Antarctic Polarundefined
undefinedLinks to be sortedundefined
undefinedOther web pages at weathercharts.orgundefined
undefinedSeismologyundefined
--------------undefined
undefined
Links to my Sisters webpages.undefined
undefinedwww.long-live-pitmans-shorthand.org.ukundefined
undefinedwww.long-live-pitmans-shorthand-reading.org.ukundefined
undefinedwww.long-live-pitmans-shorthand-lessons.org.ukundefined
undefinedwww.lucypaintbox.org.ukundefined
undefinedwww.yellow-teddy.org.ukundefined
--------------
undefinedDomain name pointers set to primary domain www.weathercharts.orgundefined
undefined
www.weathercharts.orgundefined
www.weathercharts.org.ukundefined
www.weathercharts.netundefined
www.weathercharts.co.ukundefined
www.weathercharts.ukundefined
www.weathercharts.me.ukundefined
undefinedwww.weathercharts.net . . . . sister website to www.weathercharts.orgundefined
undefinedundefinedDISCLAIMERundefined
All products content and links on this website are provided for personal interest, educational study.undefined
No guarantees are provided and no responsibility or liability borne concerning the accuracy or timeliness of the published images or data from any web link provided on this website.undefined
All charts and web links are provided on an "as is" basis, whose content, accuracy, or suitability is beyond this webmaster control.undefined
For any safety and / or navigational purposes, always consult directly with the appropriate official meteorological department.undefined
THE PRODUCTS ON THIS WEBSITE ARE NOT A SUBSTITUTE FOR OFFICIAL FORECASTS AND SHOULD ONLY BE USED FOR SITUATIONAL AWARENESS.
undefinedThis disclaimer applies to any authorised or unauthorised use of products from this website or from any of the web links provided from this website.
undefined