| www.weathercharts.org |
| Upper Air Charts - GFS model - North Atlantic - Europe - Figures in table are T+z |
|
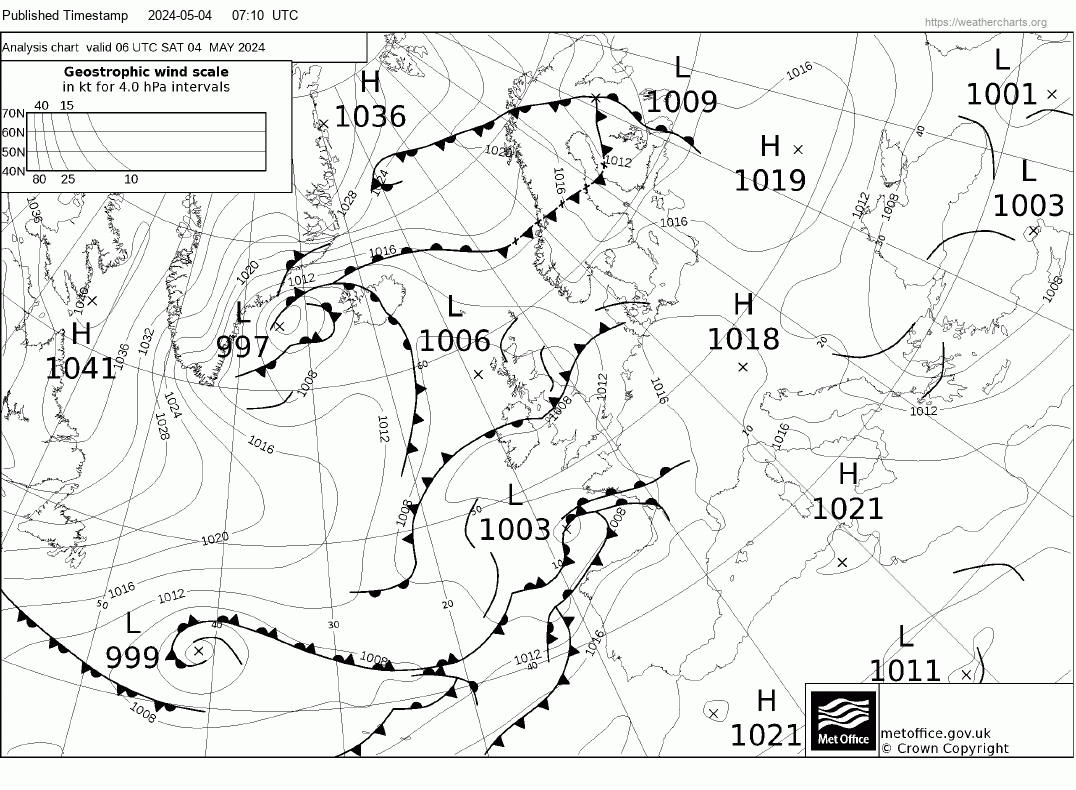
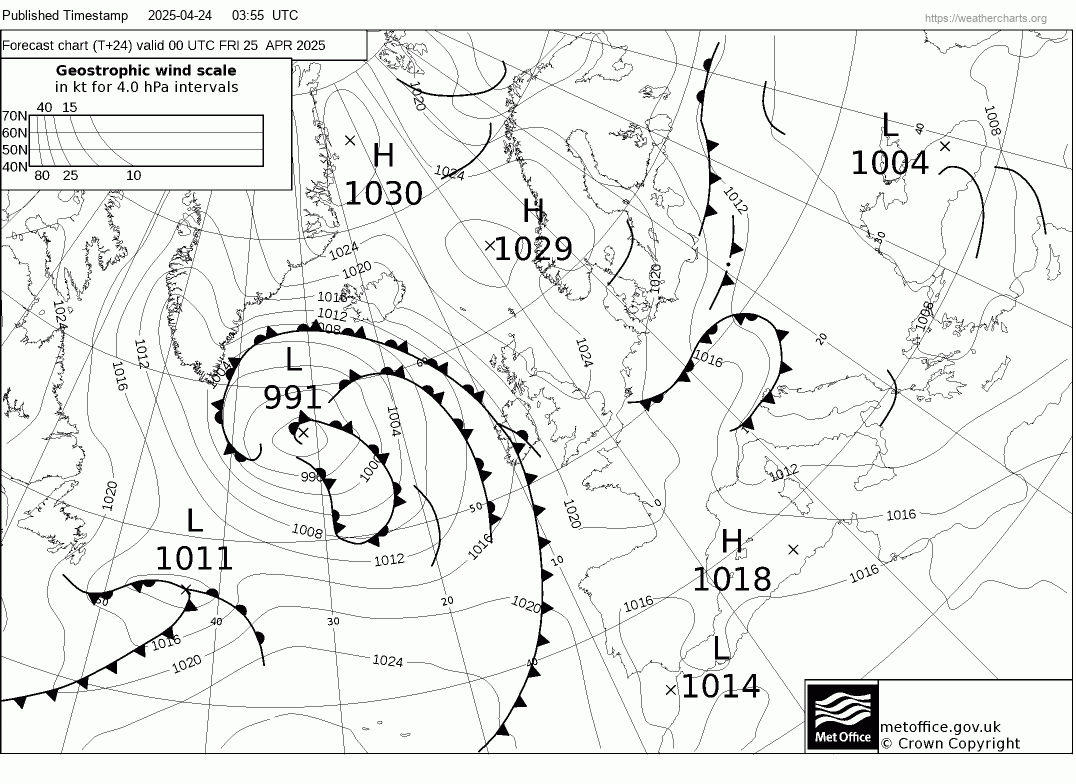
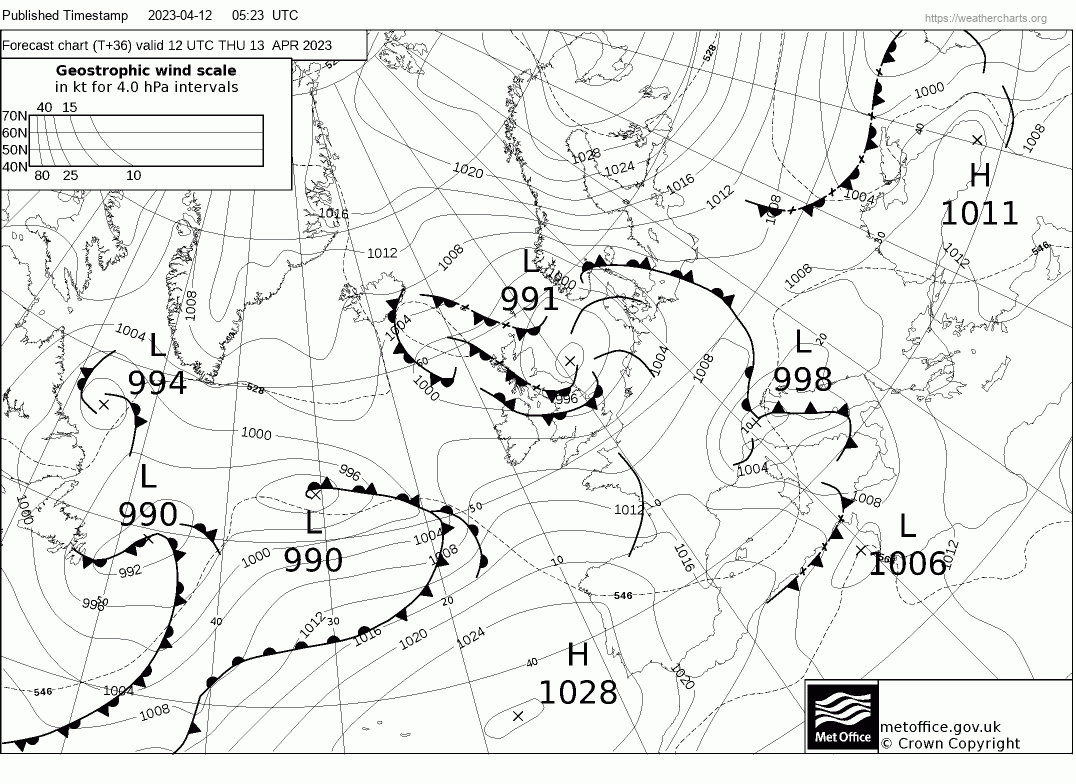
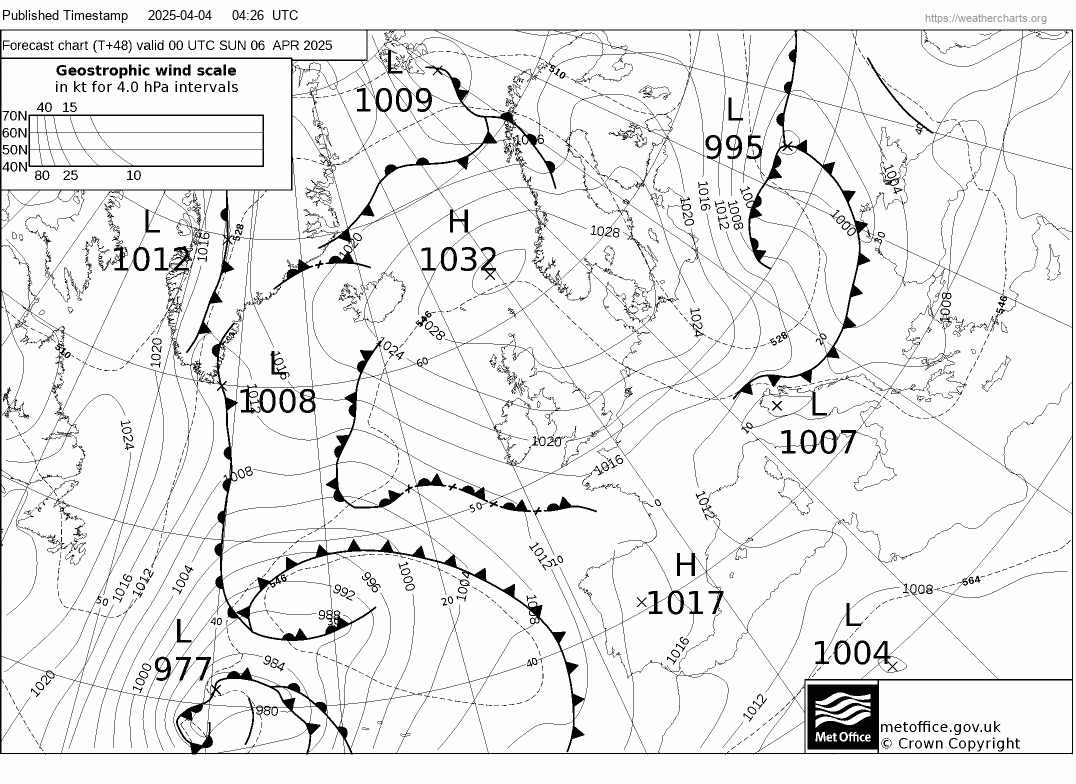
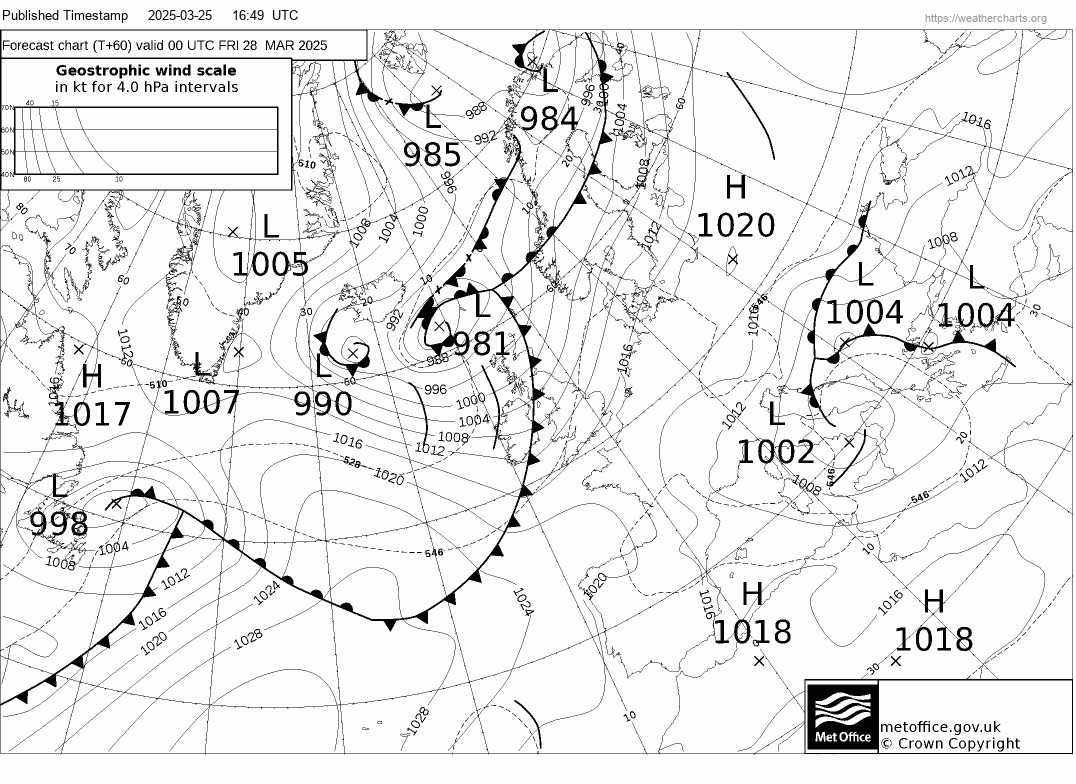
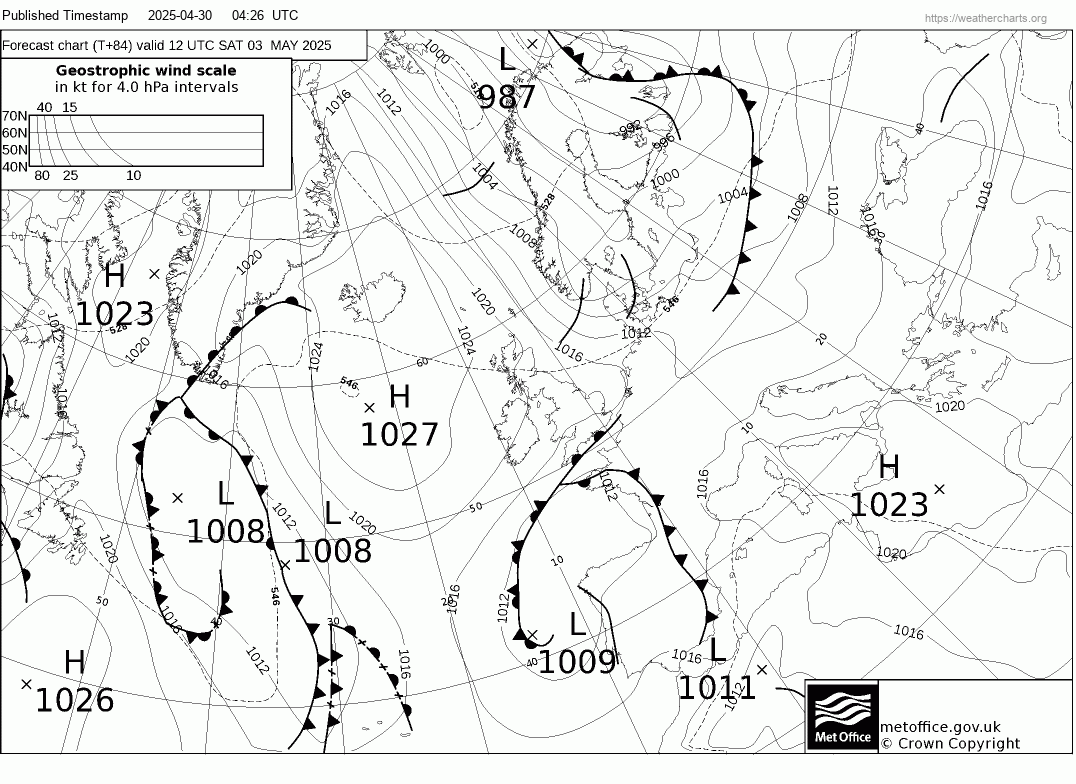
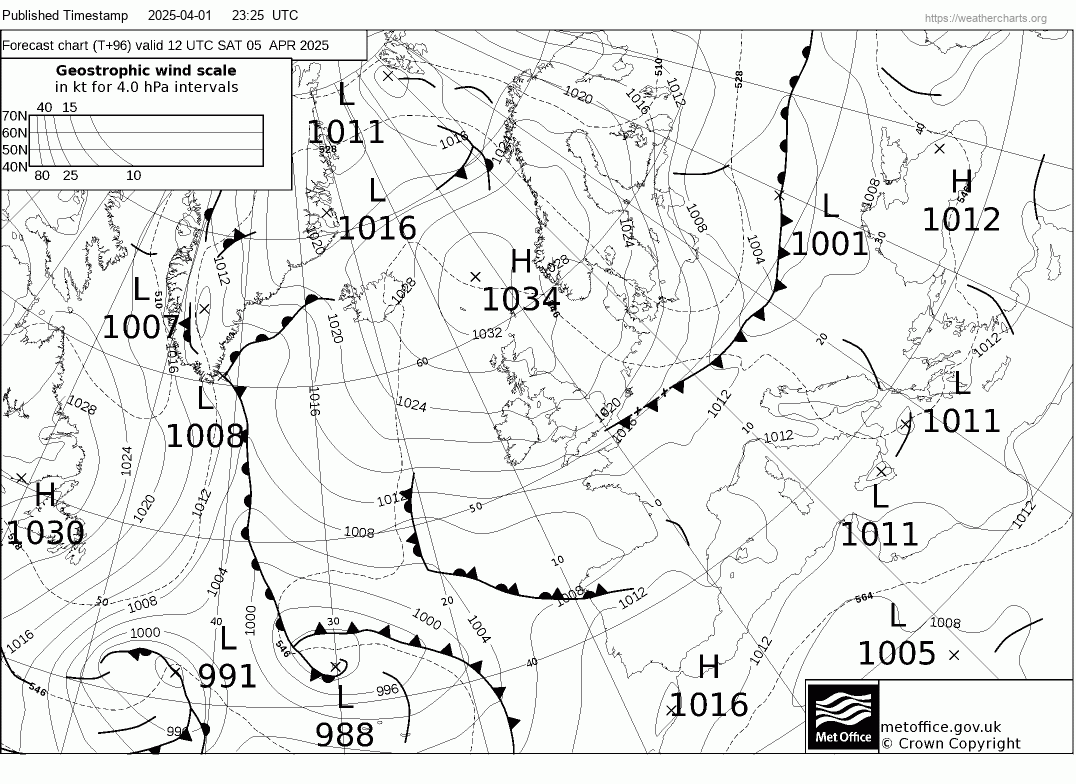
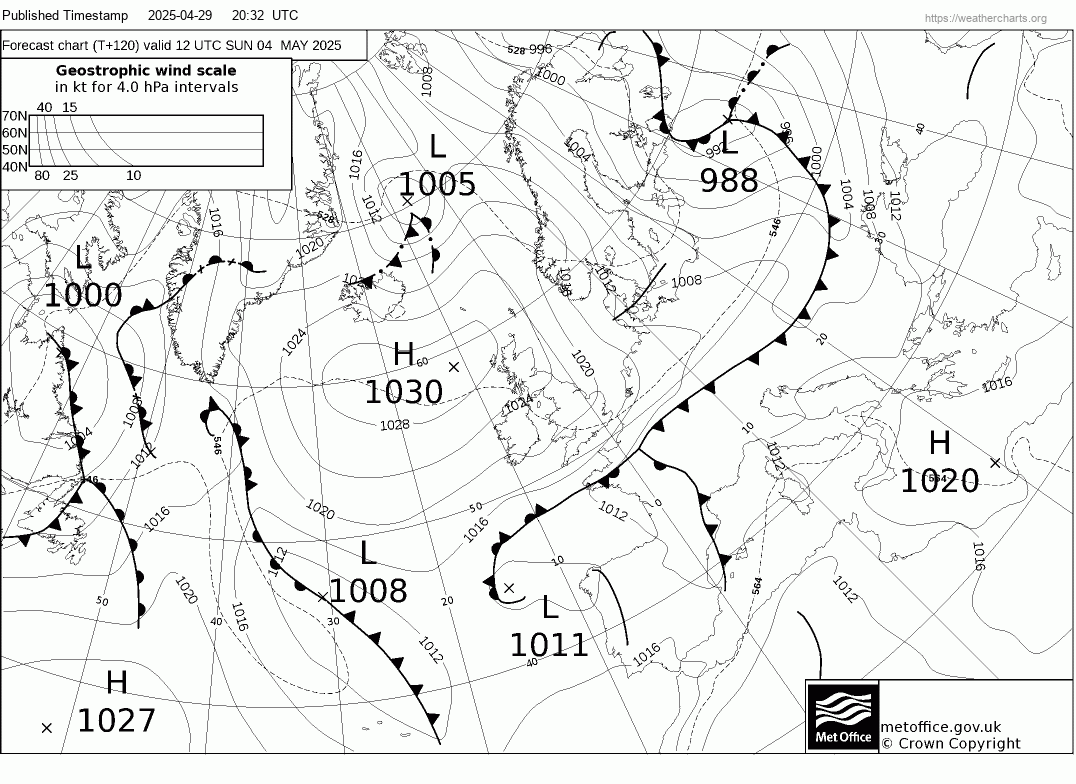
UKMO
mslp fax |
500hpa | 850hpa Temps |
Dam Thickness - Cloud Cover |
2m Temps | 10m Wind | Precipitation | Cape Lifted Index |
|
Current Analysis |
06 | 06 | 06 | 06 | 06 | 06 | 06 |
| 12 | 12 | 12 | 12 | 12 | 12 | 12 | |
| 18 | 18 | 18 | 18 | 18 | 18 | 18 | |
| 24 | 24 | 24 | 24 | 24 | 24 | 24 | 24 |
| 30 | 30 | 30 | 30 | 30 | 30 | 30 | |
| 36 | 36 | 36 | 36 | 36 | 36 | 36 | 36 |
| 42 | 42 | 42 | 42 | 42 | 42 | 42 | |
| 48 | 48 | 48 | 48 | 48 | 48 | 48 | 48 |
| 54 | 54 | 54 | 54 | 54 | 54 | 54 | |
| 60 | 60 | 60 | 60 | 60 | 60 | 60 | 60 |
| 66 | 66 | 66 | 66 | 66 | 66 | 66 | |
| 72 | 72 | 72 | 72 | 72 | 72 | 72 | 72 |
| 78 | 78 | 78 | 78 | 78 | 78 | 78 | |
| 84 | 84 | 84 | 84 | 84 | 84 | 84 | 84 |
| 90 | 90 | 90 | 90 | 90 | 90 | 90 | |
|
UKMO mslp fax |
500hpa | 850hpa Temps |
Dam Thickness - Cloud Cover |
2m Temps | 10m Wind | Precipitation | Cape Lifted Index |
| 96 | 96 | 96 | 96 | 96 | 96 | 96 | 96 |
| 102 | 102 | 102 | 102 | 102 | 102 | 102 | |
| X | 108 | 108 | 108 | 108 | 108 | 108 | 108 |
| 114 | 114 | 114 | 114 | 114 | 114 | 114 | |
| 120 | 120 | 120 | 120 | 120 | 120 | 120 | 120 |
| 126 | 126 | 126 | 126 | 126 | 126 | 126 | |
| X | 132 | 132 | 132 | 132 | 132 | 132 | 132 |
| 138 | 138 | 138 | 138 | 138 | 138 | 138 | |
| 144 | 144 | 144 | 144 | 144 | 144 | 144 | |
| 150 | 150 | 150 | 150 | 150 | 150 | 150 | |
| 156 | 156 | 156 | 156 | 156 | 156 | 156 | |
| 162 | 162 | 162 | 162 | 162 | 162 | 162 | |
| 168 | 168 | 168 | 168 | 168 | 168 | 168 | |
| 174 | 174 | 174 | 174 | 174 | 174 | 174 | |
| 180 | 180 | 180 | 180 | 180 | 180 | 180 | |
|
UKMO mslp fax |
500hpa | 850hpa Temps |
Dam Thickness - Cloud Cover |
2m Temps | 10m Wind | Precipitation | Cape Lifted Index |
Return to www.weathercharts.org